Reading my news as usual, I crossed this article from techno-science French site which shows a graph of the evolution of internet usage worldwide. I was a little disappointed when I saw it didn't go further than 2003. I could recollect that recently, various articles (engadget, hothardware), had stated that ITU declared that we had overcome the 2 Billion's users symbolic barrier.
Teased by these data, I wanted to get the over-whole view of the 1990-2011 evolution, and thought it would be not far away from some googling. Results is that while information is available, it wasn't aggregated in a statistical graphic (as far as I could manage to find on the net). So here's what I would have like to find.
Gathering data
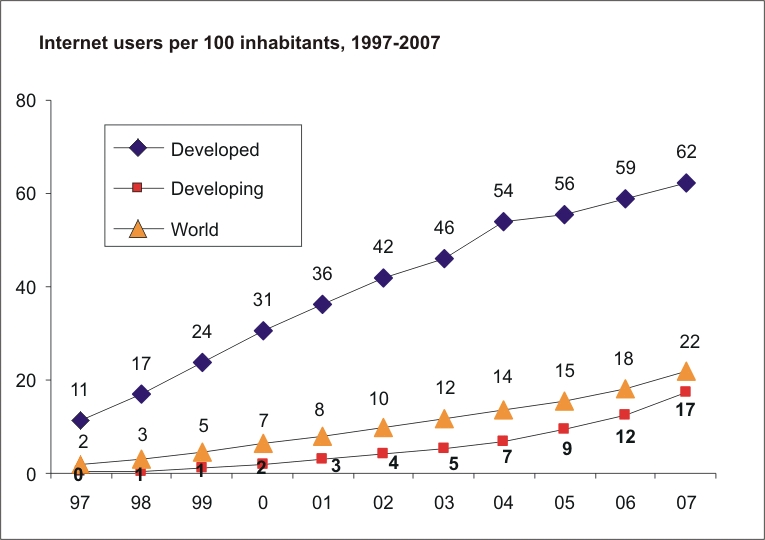
Although internetworldstats page was the source for 1995-2011 data, no graph is provided to show these data. I only could find a graph that stops at 2007 which is before getting past the 2 billion barrier.
So here's my very small contribution by aggregating these last data in one graph. Pre 1995 data are correlated from mkgray efforts. 1995-2010 data comes from internetworldstats. Both data source aren't quite measuring the same thing and should be considered with much caution as IP, domain-names, mobiles, private networks, and many other concerns will lead to different definition of "internet users". These figures give just a very rough idea of internet usage.
Result
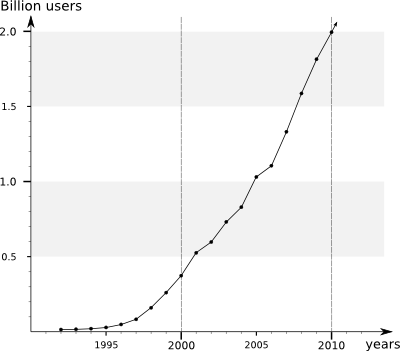
This image is my own work using internetworldstats data, and is protected under Creative Commons Attribution-Share Alike 3.0 Unported licence.
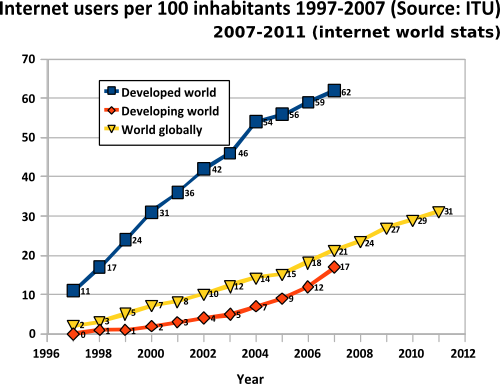
This image is based on Wiiod work which is coming from Kozuch refactor of an original ITU document. I added data from internetworldstats and worldbank.org . Figures used are rough personal approximation of both sources. This image is protected under Creative Commons Attribution-Share Alike 3.0 Unported licence.
- I suggest you take a look at those interactive graph:
- Google data browser (stops at 2008)
- worldbank.org (stops at 2009)
Analysis
In less than 15 years, 2 billions users (30% of humanity) have gained access to the internet. In the 5 last years humanity gained 1 billion users, equaling the 10 first years, and denoting a acceleration in the figures.
- Now, what's next for the 5 next years ? 3 scenarii:
- acceleration of figures is not finished: in 5 years we'll have 4 billion users and more than 60% of humanity.
- acceleration is finished, but current pace will remain: in 5 years, we'll be 3 billion users and nearly 50% of humanity.
- acceleration will reverve: in 5 years, we'll be 2.5 billion, and nearly 40% of humanity.
Whatever the figures, a such change in communication worldwide can only lead to large scale changes of our social structures (including political and business power structures).